


Page 55 - 2015年全国水利发展统计公报
P. 55
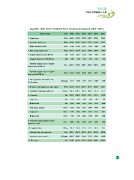
Appendix: Main Index of National Water Resources Development (2010 2015)

                      Name of index            Unit 2010 2011 2012 2013 2014 2015
1郾 Irrigated area
2郾 Farmland irrigated area                     103 ha 66352 67743 67780 69481 70652        72061
                                               103 ha 60348 61682 62491 63473 64540        65873
   Newly鄄increased in 2015                     103 ha 1722 2130 2151 1552 1648              1798
3郾 Water鄄saving irrigated area                 103 ha 27314 29179 31217 27109 29019        31060
4郾 Irrigation districts over 10郯 000 mu
                                               Unit 5795 5824 7756 7709 7709 7773
   Irrigation districts over 300郯 000 mu
                                               Unit 349 348 456 456 456                    456

   Farmland irrigated areas in irrigation      103 ha 29415 29748 30087 30216 30256 32302
districts over 10郯 000 mu

   Farmland irrigated areas in irrigation      103 ha 15658 15786 11260 11252 11251 17686
areas over 300郯 000 mu

5郾 Rural population accessible to safe         104 people 6717 6398 7294 6343 6600 6709
drinking water

6郾 Flooded or waterlogging area under control    103 ha 21692 21722 21857 21943 22369      22713
7郾 Controlled or improved eroded area          104 km2 106郾 8 109郾 7 103郾 0 106郾 9 111郾 6  115郾 5
8郾 Reservoirs                                                                              97988
                                                   Unit 87873 88605 97543 97721 97735
   Large鄄sized                                     Unit 552 567 683 687 697                   707
   Medium鄄sized                                    Unit 3269 3346 3758 3774 3799            3844
   Total storage capacity                       108 m3 7162 7201 8255 8298 8394             8581
   Large鄄sized                                  108 m3 5594 5602 6493 6529 6617             6812
   Medium鄄sized                                 108 m3 930 954 1064 1070 1075               1068

9郾 Total water supply capacity of water        108 m3 6022 6107 6142 6183 6095             6103
projects in a year

10郾 Length of dikes                                104 km 29郾 4 30郾 0 27郾 2 27郾 7 28郾 4 29郾 1
   Cultivated land under protection                 103 ha 46831 45418 42597 42573 42794 40844
   Population under protection                 104 people 59853 59697 56566 57138 58584 58608

11郾 Water gates                                       Unit 43300 44306 97256 98192 98686 103964

                                                                                                   摇51摇

